Everyone has an opinion on this. Very few people have looked at the numbers. So I did, and the answer is not the one either camp wants to hear.
Let me walk you through it the way I worked through it myself.
Start with the scary part
If you only look at valuations, the case is closed.
The Shiller CAPE stands at 41. In 145 years of data, it has been higher exactly once: at the top of the dot-com bubble.
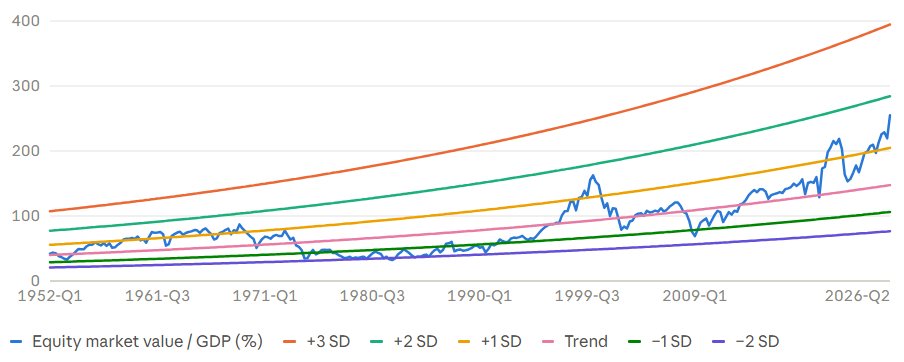
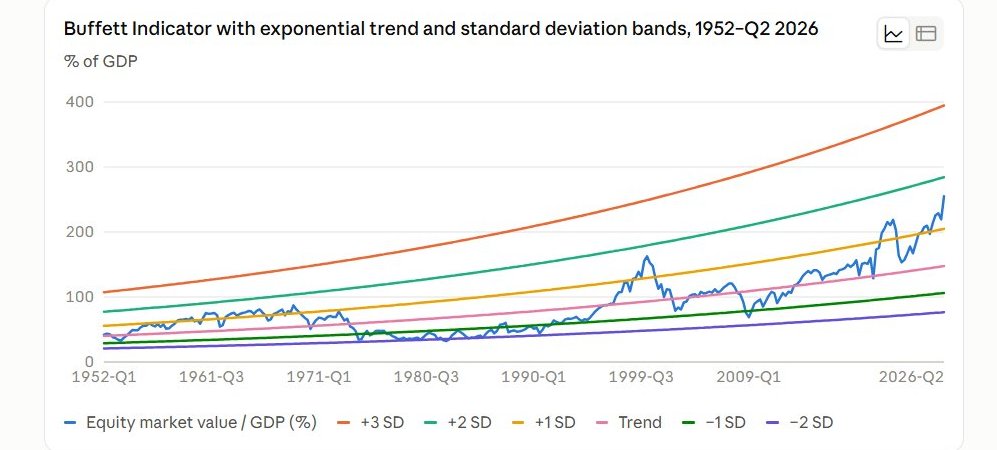
The Buffett Indicator, total market value against GDP, is at 255%. A record. Measured against its long-term trend, it is as stretched today as it was in the first quarter of 2000.
The S&P 500 trades at more than three times its revenue. Twice the normal level of the last 25 years.
Three different yardsticks, one message: this market has rarely, if ever, been more expensive.
So that’s it? Bubble confirmed?
The detail that doesn’t fit
The forward P/E of the S&P 500 is 19.5.
Compare that with its own history: the 5-year average is 19.8. The 10-year average is 19.0. The 30-year average is 17.2.
So on expected earnings, the market is priced in line with the last decade and about 13% above its 30-year norm. Somewhat elevated. Nowhere near a record.
How can a market be at record valuations on one measure and close to normal on another?
Because profits are exploding. S&P 500 earnings grew 52% last quarter, and still about 34% excluding Alphabet and Amazon, whose results included large one-off investment gains.
And this is the big difference from 2000. Back then, the ten largest stocks made up 27% of the index but delivered only 15% of its earnings. People were paying for dreams.
Today the top ten are about 40% of the index and deliver 38% of the earnings. People are paying for profits.
So the real question is not “are stocks expensive?” It’s this: how solid are those profits?
Follow the money
To answer that, you have to trace where the profits come from. And the trail leads to one place.
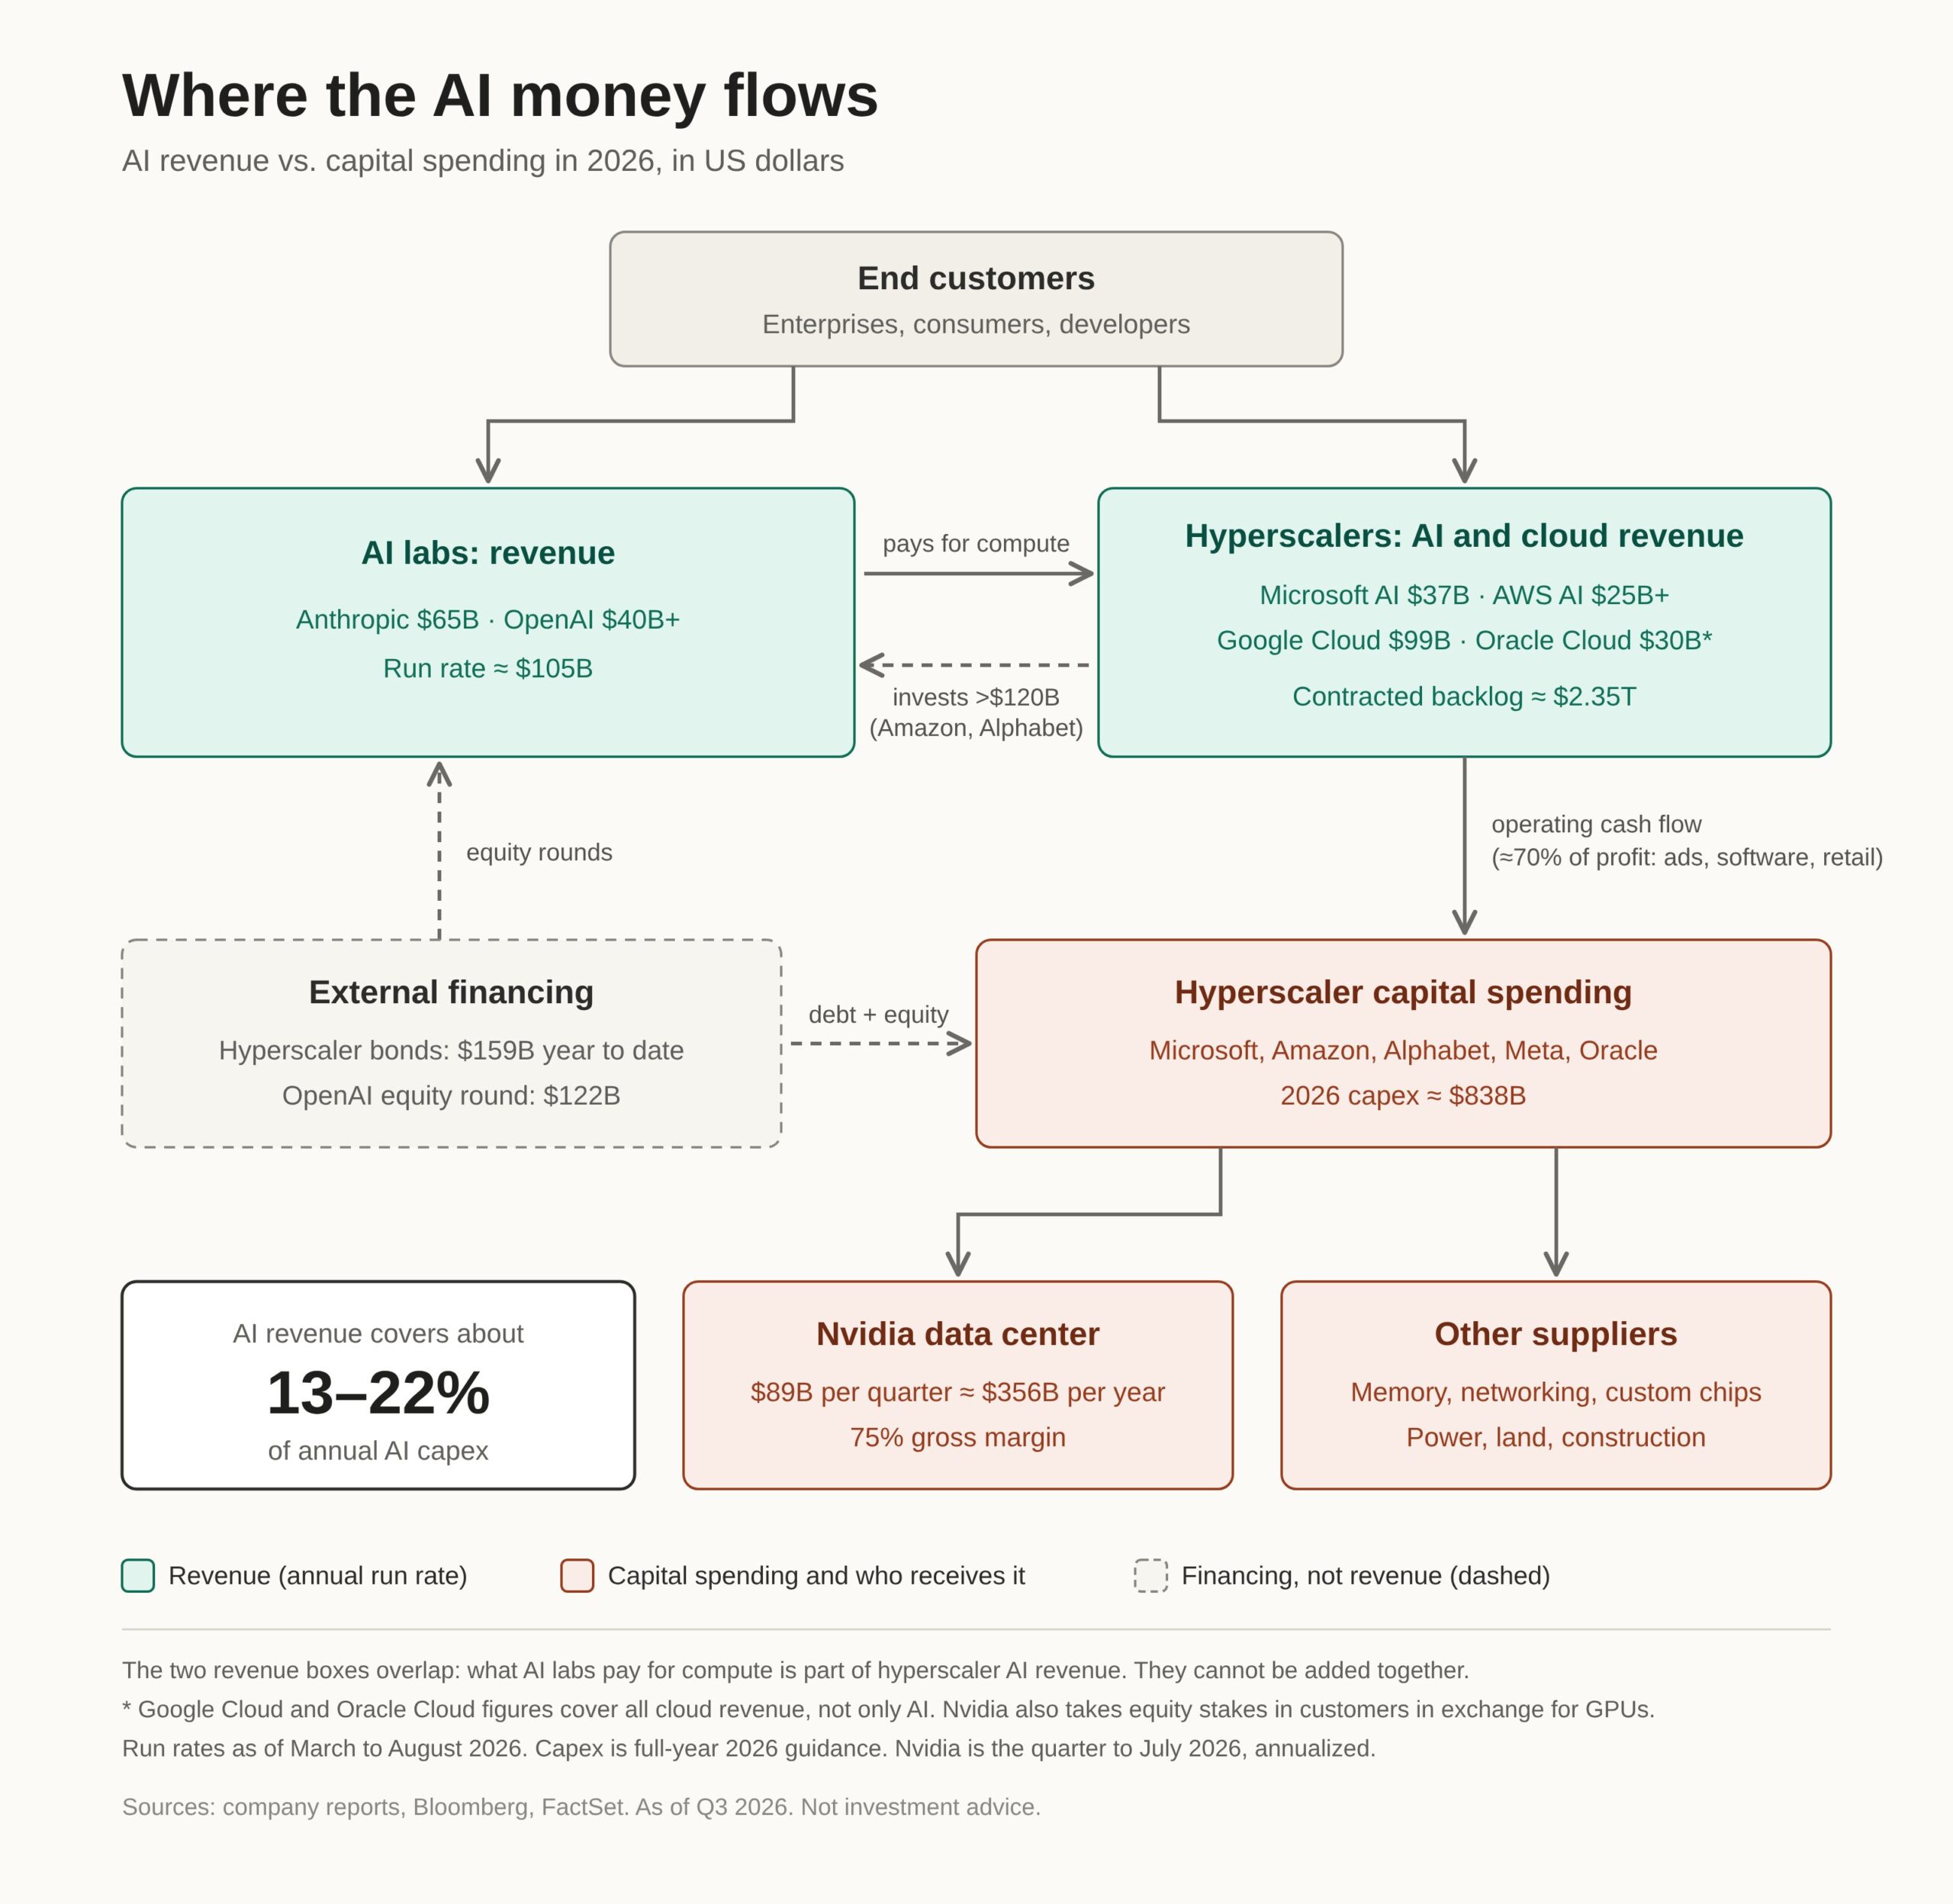
Microsoft, Amazon, Alphabet, Meta and Oracle will spend roughly $838 billion on capex this year. That’s up 77% in twelve months. Next year the projections cross $1 trillion.
Where does that money go? Mostly into chips. Which is why Nvidia earned $59.7 billion in a single quarter, at a 75% gross margin. Before the reporting season, FactSet estimated that Nvidia and Micron alone would account for about a third of all S&P 500 earnings growth for the quarter.
Now look at it from the other side of the table.
Alphabet just reported negative free cash flow for the first time in its history. Amazon’s is negative. Oracle’s is deeply negative. Meta is barely above zero.
Do you see what’s happening? The hyperscalers’ cash is becoming the chipmakers’ profit. One group’s spending is the other group’s earnings. And both sit in the same index, where the chip profits show up immediately while the costs are spread over years of depreciation.
The earnings are real. But a large part of them depends on one spending cycle continuing.
So is the spending worth it?
This is the heart of the matter. $838 billion a year only makes sense if it earns something back.
Here’s what we know. Anthropic runs at about $65 billion in annualized run-rate revenue. OpenAI at more than $40 billion. Microsoft’s AI business at $37 billion, Amazon’s at over $25 billion.
Add it up and today’s AI revenue covers somewhere between 13% and 22% of what’s being spent each year.
That sounds terrible. And the bears will add: part of it is circular. The hyperscalers fund the AI labs, and the labs spend that money on the hyperscalers’ cloud.
But the bulls have a real answer. AI revenue is growing two to seven times a year. Capex is growing less than two times. Amazon and Microsoft both say they can’t build capacity fast enough to meet demand. If that continues, the gap closes quickly.
Both sides are right about the facts. They disagree about the future. And nobody has data on the future.
What about the classic warning signs?
I checked those too, and some of what I believed going in was wrong.
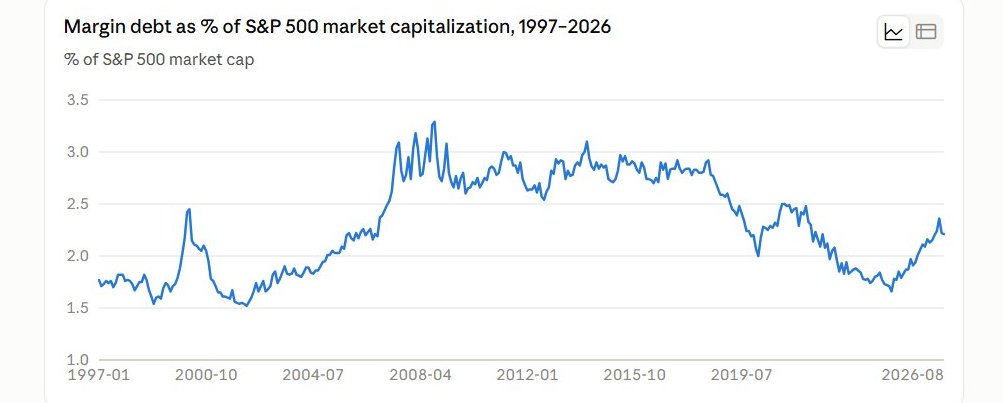
Record margin debt? It’s at $1.5 trillion, yes. But relative to the size of the market it’s perfectly average, and the level has predicted nothing in 30 years. What did precede trouble was margin debt growing much faster than stock prices. That happened in 1999, 2007 and 2021. It happened again from September 2025 to June 2026.
The earnings of the rest of the market are negligible? Also wrong.
Take out the five big AI spenders: Microsoft, Amazon, Alphabet, Meta and Oracle. Then take out the three chip giants: Nvidia, Micron and Broadcom.
By my estimate, those eight companies produce roughly a quarter of all S&P 500 earnings. The three chipmakers alone account for about 12–16%, the AI spenders for about 12%.
The other 492 companies still deliver around three-quarters. And they’re growing too: excluding the Magnificent 7 (Apple, Microsoft, Alphabet, Amazon, Meta, Nvidia and Tesla), the other 493 companies grew earnings 31.8% last quarter, the highest since 2021. That group still includes Micron, Broadcom and Oracle.
And timing? Forget it. The Buffett Indicator flashed red in 1995. The market then rose another 168% before it peaked. The indicator caught only two of the last seven major declines.
Ray Dalio, who calls this a bubble, says it himself: “Don’t sell just because there’s a bubble.” What he expects is a decade of low returns. History backs him on that part.
One more thing history teaches. Cisco was the Nvidia of 2000. It survived the crash, kept growing for 25 years, and its stock took until 2025 to get back to its old high. You can be right about the technology and wrong about the price.
So, are we in a bubble?
Here’s my answer.
By price, we are as close to 2000 as we have ever been. All three long-term valuation measures above say so.
By substance, we are far from 2000. The companies at the top are enormously profitable, and demand for what they build is real.
What we have is a market that has already paid for AI to succeed. Today’s prices assume the trillion-dollar buildout earns its money back. If AI revenue keeps catching up with capex, these prices can hold. If it stalls, the most concentrated S&P 500 on record has very little cushion, and the first place you’ll see it is in the chip stocks.
So it’s not a bubble you can prove. It’s a bet, and the whole market is making the same one.
That’s why I’m not watching price targets. I’m watching four things:
- AI revenue growth against capex growth
- Hyperscaler free cash flow
- The first capex cut
- Funding stress at the big AI labs
When one of those turns, you’ll have your answer.
Sources
Valuation: Robert Shiller (CAPE), Federal Reserve and BEA via FRED (Buffett Indicator), Standard & Poor’s (price-to-sales), FactSet Earnings Insight (forward P/E and earnings growth), J.P. Morgan Guide to the Markets (30-year P/E average).
Concentration: S&P Dow Jones Indices, Goldman Sachs.
Capex, cash flow and AI revenue: Calendar Q2 2026 company reports from Microsoft, Amazon, Alphabet, Meta, Oracle and Nvidia. Bloomberg for Anthropic and OpenAI run rates.
Margin debt: FINRA.
Ray Dalio quote: CNBC interview.
Earnings shares, capex coverage and indicator tests: my own calculations from the data above.
Not financial advice. Do your own research.
Note: This article is for information purposes only and does not constitute investment advice. Trading stocks and options involves risks up to and including total loss. More in the Risk disclosure.