First published as a guest article in the trading magazine TRADER WP, issue 03/2026, published on 30 April 2026.
Have we ever wondered why some portfolios remain stable even in times of crisis, while others collapse like houses of cards? The secret does not lie in predicting the future. It lies in using the relentless swing of the market pendulum between risk appetite (risk-on phase) and the need for safety (risk-off phase) to your advantage.
Part 1: The psychology of cycles – risk-on vs. risk-off
The market is driven by two primal forces: greed and fear. Those who can identify these phases objectively escape the herd instinct.
The risk-on phase: when greed takes over
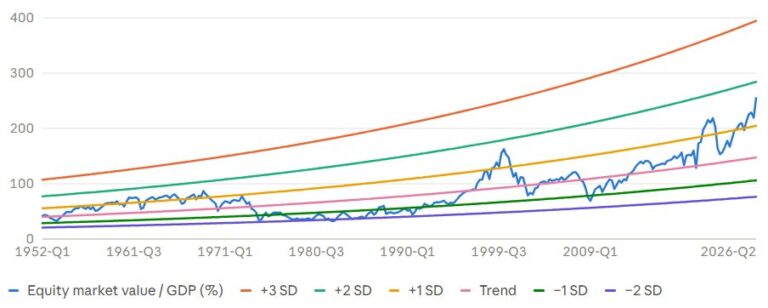
In a risk-on phase, boundless optimism prevails. The narrative of a “new era” (as most recently with the AI hype) dominates the headlines. Investors seek maximum returns and often ignore classic tools such as fundamental analysis and technical analysis. Growth stocks rise steeply, and multiples such as the price-to-earnings ratio (P/E) or the ratio of enterprise value to free cash flow (EV/FCF) fade into the background. In this phase, visions of the future count for more than actual cash flow.
The trap: you buy into a euphoria in which prices are far above fair value. Greed makes us ignore the risk of a correction.
The risk-off phase: when fear writes the narrative
As soon as the mood of the mass of investors shifts – whether due to geopolitical conflicts, inflation fears or emerging doubts about new technologies (as most recently with AI in 2026) – the pendulum swings back abruptly. A classic accelerator of this shift is interest rate hikes. These massively favour defensive value stocks over growth stocks: since growth companies usually expect their high profits far in the future, these future cash flows are discounted at a higher discount rate when interest rates rise. Mathematically, this drastically lowers the present value of these companies. More stable companies with immediate cash flows suffer considerably less from rate hikes.
Capital then flees from risky bets. Investors look for “safe havens”: companies with crisis-resistant business models, stable dividends and products that are always consumed (healthcare, consumer staples). While the masses flee into this safety and drive prices up there, tomorrow’s bargains emerge in the sold-off growth sector.
Part 2: The case study – theory in practice (2022–2026)
So what does this “shift” look like in a portfolio? Let us look at the dramatic moves of recent years and how they could be mastered by combining fundamental analysis and technical analysis.
The strategic move in 2022
Let us go back to the bear market of 2022. The S&P 500 had already lost 25 % of its value. Growth stocks such as Microsoft, Amazon and Nvidia even fell by between 40 % and 65 %. Meanwhile, defensive heavyweights such as Johnson & Johnson (JNJ), Coca-Cola (KO) and Procter & Gamble (PG) traded near their all-time highs (see Figure 1). The valuation multiples of these stocks were historically expensive, and the extended chart picture signalled clear take-profit levels.
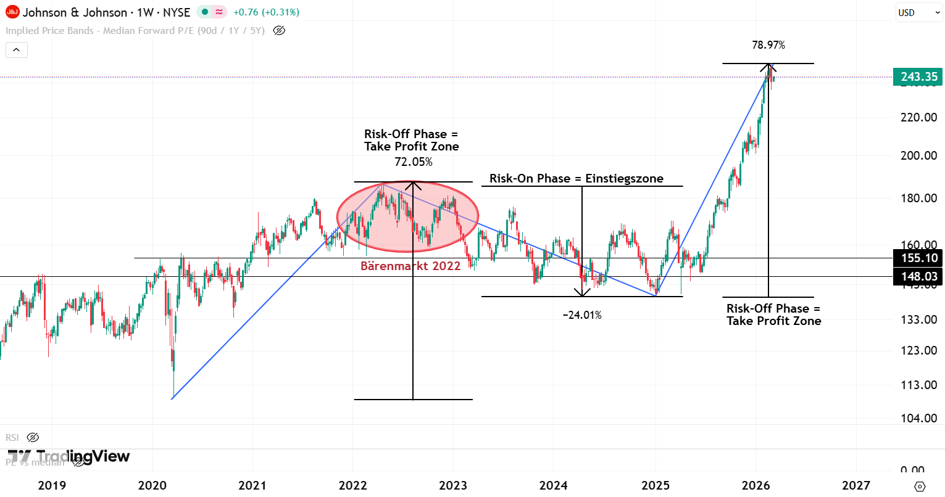
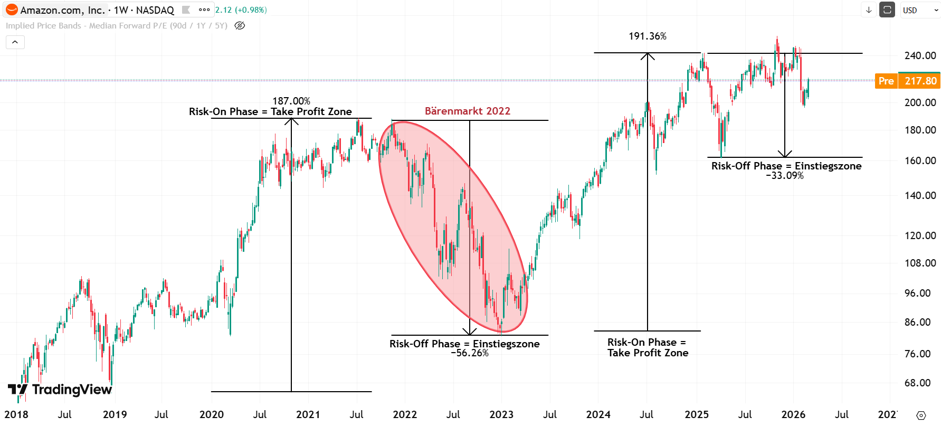
Instead of blindly following the herd and buying defensive stocks only once they are already overpriced as safe havens, this was the perfect time to take profits in exactly those stocks in order to free up capital for new opportunities. On the other side of the market, quality growth stocks such as Nvidia (NVDA), Microsoft (MSFT) and Amazon (AMZN) were being sold off massively in the bear market. Those who sold the expensive safety of JNJ in 2022 had the liquidity needed to buy where there was “blood in the streets”.
These stocks should not be bought blindly. As with defensive stocks, objective fundamental metrics and technical chart features should be used for selection here as well. Microsoft (MSFT) traded at around USD 250 and Amazon (AMZN) at approx. USD 110, while Nvidia (NVDA) was available for around USD 18, split-adjusted (see Figure 2).
2023 to 2025: The rotation back
The pendulum swung back. While growth stocks hit new records, Johnson & Johnson, like many other defensive value stocks, corrected by around 25 % until 2025. Many investors lost interest in the “boring” stock. For the strategic investor, however, all criteria for re-entry were met:
- Multiples: P/E, P/FCF and EV/FCF compressed to historically attractive levels.
- Support: the technical zones at USD 155 and USD 148 were reached – ideal points for a gradual entry.
At the same time, the counterparts in the growth sector delivered an impressive performance: Microsoft, Amazon and Nvidia rose by 100 %, 180 % and a massive 900 % in just two years.
2025 to today: The correction always comes
While many investors basked in AI euphoria in 2025, the heavyweights of the growth sector reached extreme extension levels. The pendulum was at its limit. Those who had the discipline to take profits consistently at this point now have the “dry powder” that others lack.
Because while defensive stocks found their floor, disillusionment set in among the former high-flyers. Since their highs in 2025, the giants have shown signs of fatigue: Microsoft (MSFT) and Amazon (AMZN) moved into a sluggish sideways phase and at times lost around 15 % to 20 % of their value, as high expectations for AI monetisation met the hard reality of valuations. Even stock market star Nvidia (NVDA) could not maintain its explosive pace and corrected by more than 40 % from its top.
At this point, many investors fall into a dangerous psychological trap: one might mistakenly believe that holding the stock was the right decision in hindsight, simply because today – in March 2026 – it is still around 15 % “in the green” compared with the start of the rotation. But those who understand the pendulum know: a positive return of 15 % does not justify the risk taken if you have to be prepared to sit through an extreme historical extension and the potential of a 50 % correction.
Professional portfolio management means committing capital where the reward-to-risk ratio is most attractive. Those who speculated on squeezing the last cent out of the hype in Nvidia ignored the far safer 40–60 % in defensive stocks such as JNJ over the same period. Just because you were not immediately punished for a risky manoeuvre does not mean the decision was statistically right. Professionals do not look at what they could have gained in the best case; they look at how much capital they have to risk to achieve that gain.
We are currently seeing the result of this rotation: many defensive stocks such as Johnson & Johnson (JNJ) have recovered from their lows and are trading near the 200 % Fibonacci mark. For the strategic investor, this is not a reason to buy more, but a clear signal for partial sales. Depending on timing, in the JNJ example returns of 40–75 % plus dividends could be realised here – with a stock that only recently was considered “dead”.
The conclusion: History does not repeat itself, but it rhymes
One could argue that the specific triggers – such as the launch of ChatGPT at the end of 2022 or the AI disillusionment in early 2026 – were not foreseeable. They do not have to be. Anyone who analyses markets historically recognises that the risk-off/risk-on shift is a natural law of psychology. The triggers change, but the pattern remains:
- Greed leads to ignorance of fundamentals, which often leads to overvaluation.
- Fear leads to a flight into (overpriced) safety and leaves quality stocks on the shelf.
Those who understand the pendulum of the pros do not move their capital out of emotion, but according to plan. They buy the fear and sell the greed.
The craft behind the success
This case study shows: outperformance is not a product of chance. It is the result of a clear system. We use:
- Fundamental analysis, to distinguish fair valuation from hype.
- Technical analysis (retracement and extension levels) to refine the timing.
- Sentiment analysis (fear/greed) for sector rotation.
Those who learn to read the psychology behind volatility no longer need to fear market corrections. You begin to see them for what they are: the greatest opportunity for the next successful shift.

I describe the strategy behind this in detail in my book »Financial Freedom through Stocks – A Swing Trading Strategy«.
Disclosure
Written by Philip Leuthe for TRADER WP, issue 03/2026 (published on 30 April 2026). Republished on invest4h.com on 24 October 2026.
Conflicts of interest: At the time of writing and first publication, the author held shares of Johnson & Johnson (JNJ), Nvidia (NVDA), Microsoft (MSFT) and Amazon.com (AMZN). At the time of republication (24 October 2026), the author holds shares of Nvidia (NVDA) and Amazon.com (AMZN); no positions in Johnson & Johnson or Microsoft.
Not financial advice. Do your own research.
Note: This article is for information purposes only and does not constitute investment advice. Trading stocks and options involves risks up to and including total loss. More in the Risk disclosure.