
First published as a guest article in the trading magazine TRADER WP, issue 05/2024, published on 19 September 2024.
Using market volatility to your advantage without spending the whole day in front of a screen? That is possible with tools from technical and fundamental analysis, combined in a compact swing trading approach.
What is swing trading?
Swing trading is like a gentle sea breeze – you catch the wind (or, in our case, the trend) and ride it to the next price target. In doing so, you use market corrections to open positions at support zones. But be careful: not every wave is rideable. That is why we also check the fundamentals before jumping into a trade. Solid fundamentals considerably increase the probability that an existing trend will continue, and thereby ultimately also the hit rate of a trade.
Technical analysis meets fundamental analysis
You may now be wondering why we should combine these two approaches. Quite simply: while technical analysis shows us when to enter, fundamental analysis gives us the necessary confidence in the trade. Imagine you are planning a road trip. Technical analysis is your traffic light, showing you the best time to set off and to stop. Fundamental analysis, on the other hand, is the navigation system that assures you that you are on the right route.
The process
Stock screening
First, we run a stock screen. We set specific metrics in a stock screener to pre-select the right stocks. Stocks that do not meet the fundamental criteria are filtered out, as they are not suitable for investment. There is a wide range of metrics that can be applied – some are important, others less so. Overall, in the invest4h approach, on which my book Live Coaching is also based, these metrics can be divided into three broad categories: growth, valuation and warning signs.
The warning-sign category includes, for example, metrics such as the debt ratio and the payout ratio. These are generally less important unless they exceed certain thresholds, in which case investing in these stocks would be ruled out. Valuation metrics are mainly earnings multiples such as the enterprise value/free cash flow ratio, the Shiller P/E ratio and the forward P/E ratio, among others. The company’s profit margins also matter. The last category, growth, comprises metrics on past and future earnings and revenue growth.
This multitude of criteria may sound overwhelming at first, but after a short time the check becomes routine, and the stock screener does a large part of the work for us. Only companies that meet the most important fundamental criteria make the shortlist and are then analysed technically.
Analysing charts – identifying trends
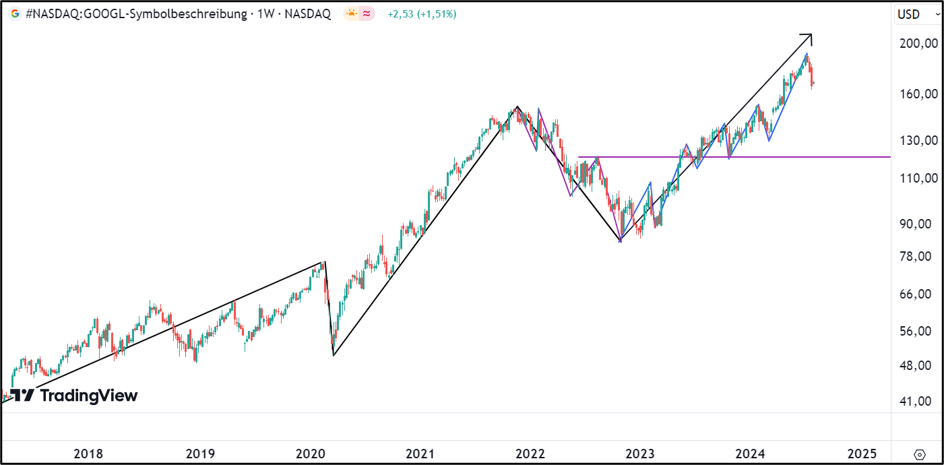
Once you have identified a reasonable number of companies, it is time for the charts. We go through the charts stock by stock and check whether uptrends exist on the largest timeframes and whether any downtrends (our opponents) stand in the way. Let us look at a simple example using Alphabet stock (Figure 1). Several features stand out. First, the two largest trends point upwards (black and blue trend). In addition, the purple downtrend has already been broken and therefore no longer exerts any downward pressure. Both are positive characteristics. So, after checking the fundamentals, we could enter on a correction. Whether we decide to trade the black or the blue trend determines our trading frequency and the holding period of our investment.
Entries – defining support zones
For the stocks whose charts look best – that is, those with intact, dynamic uptrends and no or only weak downtrends – we now identify support zones (support levels). Once the market goes through a correction and reaches a support zone, things get interesting. This is where we lie in wait to open our position. This can be done simply by setting a price alert at the corresponding support level.
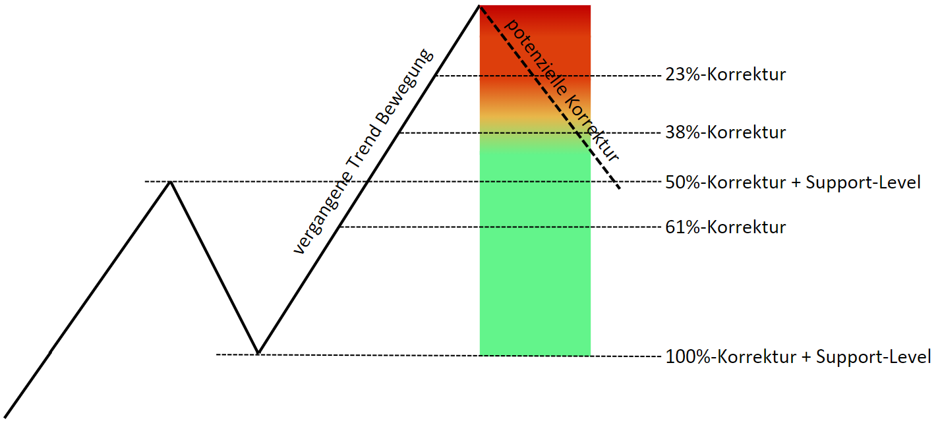
Another important question is how far the current move of a trend will retrace before the next impulse in the direction of the trend continues. This can give support zones more weight. A valid way to measure the depth of a trend’s correction is Fibonacci retracements. For example, the Fibonacci retracement zones of 38 %, 50 % and 61 % of the existing trend leg can be defined as highly valid. In these areas, support zones have an increased probability that the turn from correction to the next move in the direction of the trend will take place.
This logic and the various nested trend sizes result in a large number of tradable setups with different hit rates and reward-to-risk ratios. Some of these trading setups are considerably more promising than others. Figure 2 shows the interplay between support zones and Fibonacci retracement levels within an uptrend.
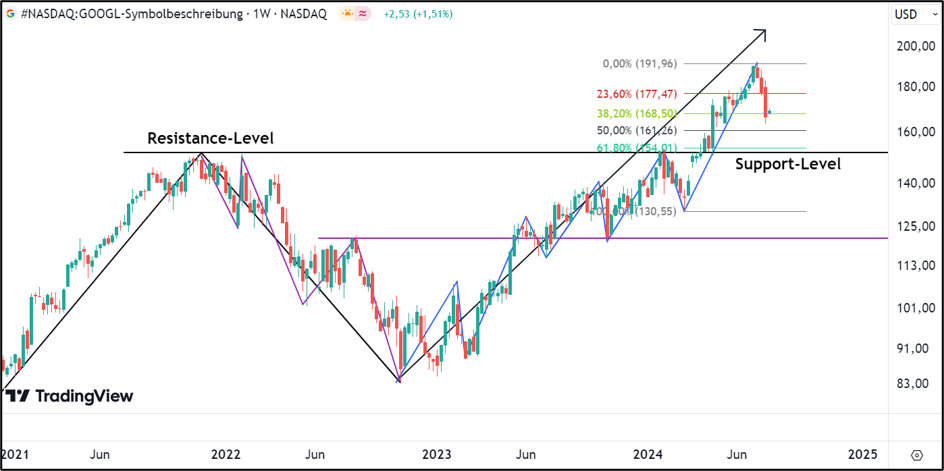
Using Alphabet stock in Figure 3 as an example, a massive support zone of the large black uptrend can be identified at a glance. It matches the 61 % Fibonacci retracement level of the smaller blue uptrend almost exactly. This further increases the significance of this support level. At a point like this, setting a price alert would make sense.
Entry and monitoring
Now all we have to do is wait until our broker notifies us that the price level has been reached. Before we pull the trigger, however, we take another quick look at the key metrics. Is everything still in order? Then we open the position and enjoy the ride.
Exits
Right after entry, we place the take-profit order, calculated from extension levels. The Fibonacci extension tool can be used for this. The levels 161 %, 200 %, 223 % and 261 % are mostly useful, but it depends on the type and dynamics of the stock – and also on whether there are any opposing downtrends that could spoil our plans.
Four hours a week …
… should be entirely sufficient to screen the market, analyse the charts of around 10–15 stocks per week and set price alerts for them. As long as the investment moves in the desired direction, no further adjustments are needed, and we have time to devote ourselves to the nice things in life, such as a relaxing day at the beach, reading a good book or enjoying the well-earned gold coins on the next city trip.
What if things don’t go so well?
When it comes to exiting a position that is moving into a loss, there are several options you can consider. A popular method is the use of stop-loss orders. These can either be placed directly in the market or set mentally, and they are useful for avoiding larger losses if an uptrend breaks.
However, stop-loss orders are not for everyone. Many traders find it difficult to consistently close positions that are in the red, as this can be psychologically stressful. If you count yourself among this group, there is an alternative strategy you can consider: extend your fundamental criteria and select only stocks with a long dividend history and steady dividend growth. These defensive stocks often offer more stability and security.
With well-selected defensive dividend stocks, buying more on price declines can often make more sense than getting stopped out. A crucial aspect of this strategy is diversification. A broadly diversified portfolio of different defensive stocks considerably reduces the risk of individual stock fluctuations. This diversification allows you to stay calm when individual positions pull back and to act strategically instead of panicking.
If one of your stocks starts to fall, it is advisable to review the fundamental data again. If the company continues to show solid financial metrics and the dividend remains stable, buying more can be considered. This approach lowers your average entry price and increases your potential gains when the price recovers. During periods of weakness, the dividend can additionally be reinvested to add shares at favourable prices.
But beware: if a company cuts or suspends its dividend, selling the position immediately is advisable, as this is often a sign of deeper problems within the company and could jeopardise your investment.
With this strategic approach, you can use market fluctuations to your advantage and benefit from the strength of a diversified portfolio in the long term.
Overall, stop-loss orders and the extension of the fundamental criteria combined with sufficient diversification offer two different but effective risk management approaches. Choose the method that best suits your trading psychology and risk profile.
A detailed explanation and step-by-step guide to this trading strategy, including the application of technical analysis, can be found in my book »Financial Freedom through Stocks – A Swing Trading Strategy«.
No stock picking? No problem!
If stock picking is not your thing, you can apply the approach described, slightly modified, to a stock index, such as an ETF on the S&P 500 or MSCI World. In this alternative, we use technical analysis only.
We apply the various retracement levels and support zones to an index of our choice and thereby buy into the entire stock market step by step. In this way, we benefit from the long- and medium-term fluctuations of the market.
Here, the cash ratio is increased or reduced step by step depending on the extension or retracement level of the overall market. This strategy could be described as a combination of a buy-and-hold approach with timing aspects from swing trading. You are almost always invested with a certain percentage of your total capital, but you adjust the investment ratio depending on market fluctuations.
This approach is particularly well suited to medium- to long-term investors who have only limited time for stock analysis. A decisive advantage is that you secure your profits during the market’s boom phases and then re-enter at favourable prices with the cash reserve you have built up when the market pulls back. A stock market strategy does not have to be complicated, but certain criteria should be clearly defined. These include a sensible entry logic that takes market phases into account, diversification, and an exit logic for both profits and losses. These factors should also fit the investor’s lifestyle and routine.
Happy investing!

Disclosure
Written by Philip Leuthe for TRADER WP, issue 05/2024 (published on 19 September 2024). Republished on invest4h.com on 24 October 2026.
Conflicts of interest: At the time of writing and first publication, the author held shares of Alphabet Inc. (GOOGL). At the time of republication (24 October 2026), the author holds no position in Alphabet Inc.
Not financial advice. Do your own research.
Note: This article is for information purposes only and does not constitute investment advice. Trading stocks and options involves risks up to and including total loss. More in the Risk disclosure.

